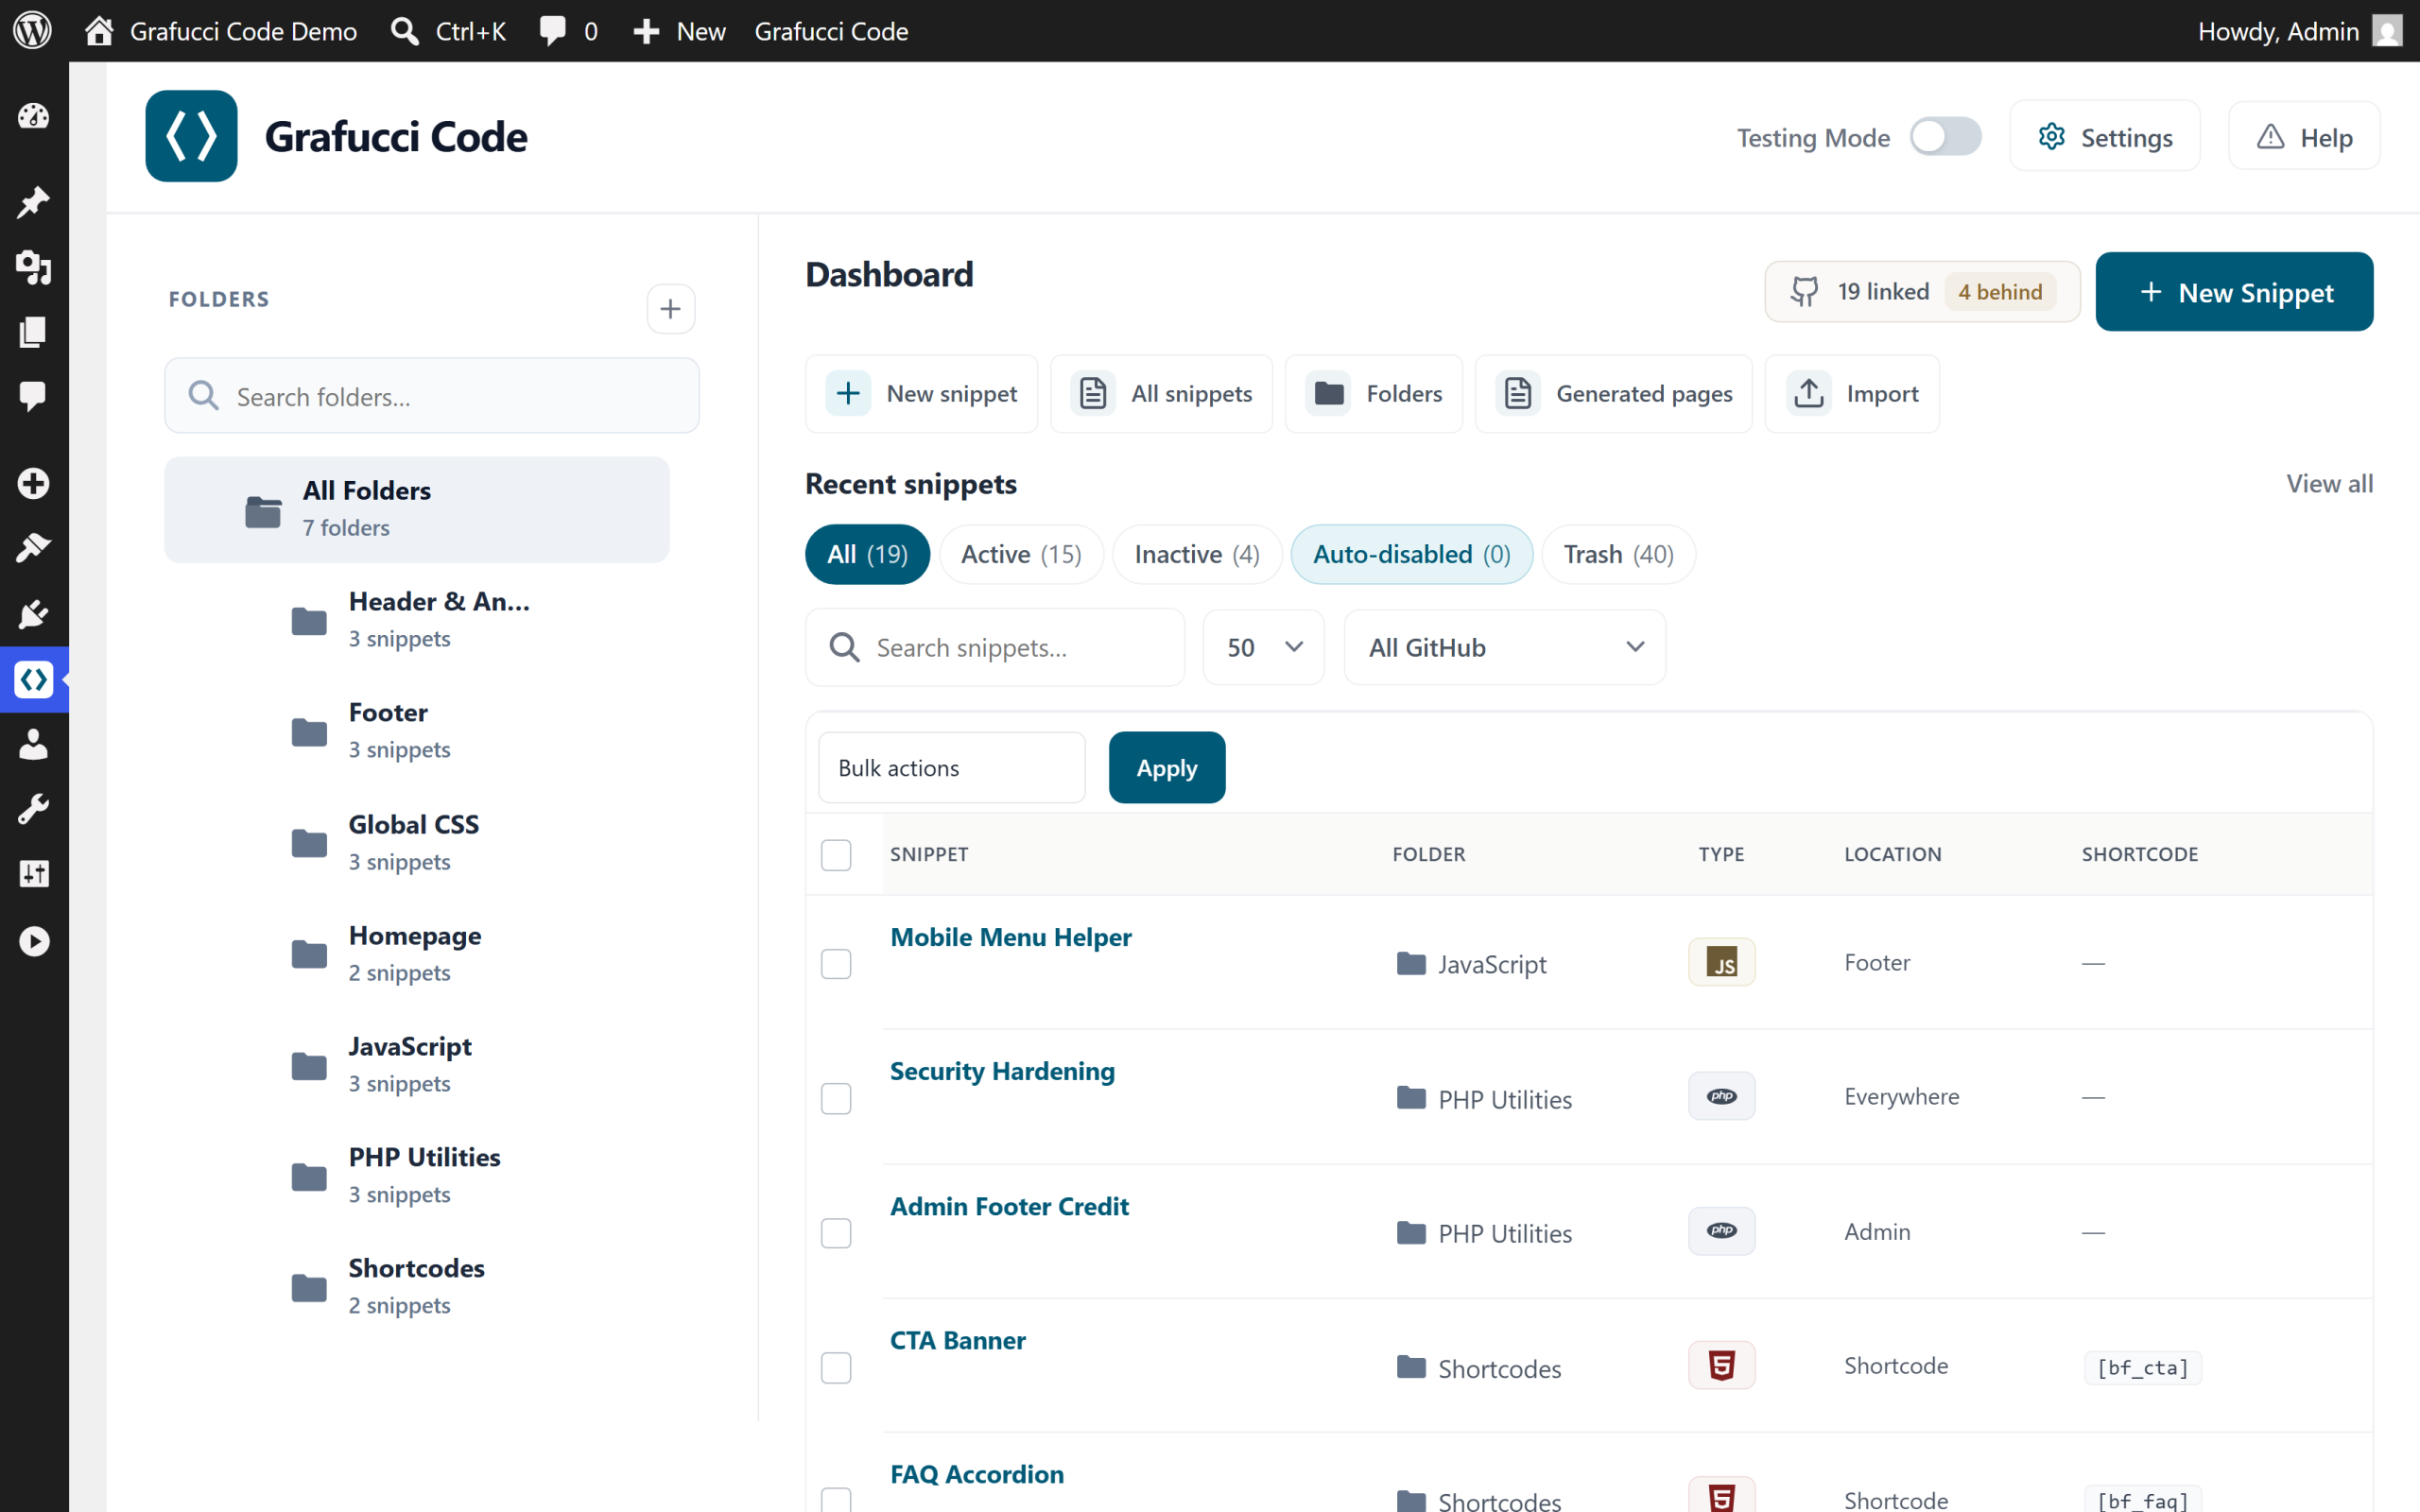
Dashboard
The dashboard is your starting point: active snippets, attention chips, recent errors, and shortcuts into the library.
What you see
- Overview cards for active snippets, folders, and safety status
- Attention chips — PHP off, Safe Mode, sync conflicts, or items needing review
- Recent error log entries with links to Tools → Error logs
- GitHub Sync summary when Pro is active (linked files, pending pull/push)
- Snippet table with type, location, and activation state
- Quick actions: Add snippet, open settings, GitHub Sync (Pro)
- Admin toolbar links for Add snippet, GitHub, and Upgrade